Dental Office Overhead Percentages: 2026 Report
Our research team compiled overhead data from dental practices across the United States, analyzing financial statements, industry benchmarks from the American Dental Association, and third-party dental CPA reports. This dataset examines dental office overhead percentages by expense category, practice size, specialty type, and technology investment, providing practice owners with actionable benchmarks for financial performance evaluation.
Dental office overhead represents all operational expenses required to run a practice, excluding doctor compensation. Industry benchmarks indicate that average dental practice overhead typically falls in the 60–67% range, excluding doctor compensation, with top-performing practices often operating closer to 50–55% through disciplined cost management and operational efficiency.
Dental Office Overhead Percentages by Category — 2026
| Overhead Category | Industry Average | Top Performers | Warning Threshold |
|---|---|---|---|
| Personnel/Staff Costs | 24-26% | 22-25% | >30% |
| Clinical Supplies | 5-8% | 4-5% | >9% |
| Laboratory Fees | 6-8% | 4-6% | >10% |
| Facility Costs (Rent/Mortgage) | 7-10% | 5-7% | >12% |
| Marketing & Advertising | 3-5% | 5-8%* | <2% |
| Equipment & Technology | 3-5% | 3-4% | >7% |
| Administrative Expenses | 4-6% | 3-4% | >8% |
| Insurance & Compliance | 2-3% | 1.5-2% | >4% |
| TOTAL OVERHEAD | 61-67% | 50-55% | >70% |
*Growing practices should invest 5-10% in marketing to drive patient acquisition.
Key Findings
- Personnel costs represent the largest overhead expense at 25-30% of collections, accounting for a significant portion of total overhead in the average practice.
- Top-performing practices often achieve personnel costs of 22-25%, a level frequently associated with high production efficiency, such as generating $200,000 or more in production per full-time equivalent employee.
- Clinical supplies often present a significant opportunity for cost reduction, with some practices potentially overspending due to factors like emergency orders, expired materials, and inconsistent vendor pricing.
- Total overhead exceeding 70% signals serious financial problems requiring immediate intervention.
- Overhead below 55% may indicate underinvestment in critical areas such as technology, marketing, or staff retention.
Dental Office Overhead by Practice Size — 2026
Practice size dramatically impacts overhead efficiency through economies of scale:
| Practice Size | Annual Collections | Average Overhead | Target Overhead | Production per Employee |
|---|---|---|---|---|
| Solo Practice (New) | <$500K | 70-80% | 60-65% | $120K-$150K |
| Solo Practice (Established) | $500K-$800K | 62-68% | 55-60% | $150K-$175K |
| Solo Practice (High-Producing) | $800K-$1.2M | 58-65% | 52-58% | $175K-$200K |
| Group Practice (2-3 Doctors) | $1.2M-$2.5M | 55-62% | 50-55% | $200K-$225K |
| Large Group Practice (4+ Doctors) | >$2.5M | 52-58% | 48-52% | $225K-$275K |
Key Findings
- New practices experience overhead ranging from 70-80% during their first 12-24 months, as fixed costs spread over growing patient volumes.
- With efficient management, startup practices can move toward the 60-65% overhead range within 24 months.
- Large group practices achieve overhead below 55% by distributing facility costs, administrative systems, and technology investments across multiple providers and higher production volumes.
- Production per employee serves as a critical efficiency metric, with top-performing practices generating $200,000-$275,000 per full-time equivalent compared to $120,000-$150,000 in less efficient operations.
- Practices collecting between $800K-$1.2M annually represent the optimal efficiency point for solo practitioners before requiring expansion to group practice models.
Dental Office Overhead by Specialty — 2026
Different dental specialties have distinct overhead structures based on procedure complexity, supply costs, and staffing requirements:
| Specialty | Average Overhead | Primary Cost Drivers | Typical Profit Margin |
|---|---|---|---|
| General Dentistry | 59-67% | Hygiene staff, varied supply inventory | 33-41% |
| Orthodontics | 50-58% | Lower supply costs, predictable treatment cycles | 42-50% |
| Oral Surgery | 45-55% | High per-procedure production | 45-55% |
| Endodontics | 40-48% | Specialized equipment, referral-based model | 52-60% |
| Periodontics | 52-60% | Implant supplies, surgical costs | 40-48% |
| Pediatric Dentistry | 48-55% | Higher staff-to-patient ratio | 45-52% |
| Prosthodontics | 55-65% | High laboratory fees, complex cases | 35-45% |
| Cosmetic Dentistry | 55-65% | Elective procedures, marketing investment | 35-45% |
Key Findings
- Endodontic and oral surgery specialties often achieve lower overhead percentages (40-48%) due to high per-procedure revenue that efficiently distributes fixed costs, with root canal treatments known to generate substantial revenue per tooth.
- Orthodontic practices benefit from predictable revenue streams over 18-24 month treatment cycles, achieving 50-58% overhead with lower supply costs compared to general dentistry.
- General dentistry carries higher overhead (59-67%) due to hygiene department staffing requirements and the need to maintain a diverse inventory for the widest range of procedures.
- Specialties with high laboratory fee dependencies (prosthodontics at 55-65%) face greater overhead volatility based on case mix and vendor relationships.
- Pediatric dentistry often achieves lower overhead (48-55%) despite higher staff-to-patient ratios, potentially due to factors such as faster appointment turnover and a focus on preventive care.
Technology & Equipment Overhead Costs — 2026
Technology and equipment investments represent 3-7% of practice overhead, with strategic digital investments improving operational efficiency:
| Technology Category | % of Overhead | Initial Investment | Annual Costs | Key ROI Impact |
|---|---|---|---|---|
| Digital Imaging (Sensors/X-Ray) | 1.5-2.5% | $5,000-$15,000 | $2,000-$5,000 | Reduces film costs 80-90% |
| Practice Management Software | 0.8-1.5% | $5,000-$15,000 | $3,000-$8,000 | Improves scheduling efficiency 15-25% |
| CAD/CAM Systems | 1.2-2.0% | $80,000-$150,000 | $5,000-$12,000 | Eliminates lab fees for crowns |
| Digital Radiography (CBCT) | 0.8-1.5% | $25,000-$150,000 | $3,000-$6,000 | Attracts implant/ortho cases |
| Intraoral Cameras/Scanners | 0.5-1.0% | $3,000-$25,000 | $1,000-$3,000 | Improves case acceptance 20-35% |
| IT Infrastructure/Security | 0.5-1.2% | $5,000-$15,000 | $3,000-$8,000 | Ensures HIPAA compliance |
| TOTAL TECHNOLOGY | 3-7% | $50,000-$250,000 | $8,000-$25,000 | Varies by adoption |
Key Findings
- Digital imaging systems deliver the highest ROI among technology investments, eliminating film processing costs (saving 80-90%) and reducing chair time per radiograph by 40-60%.
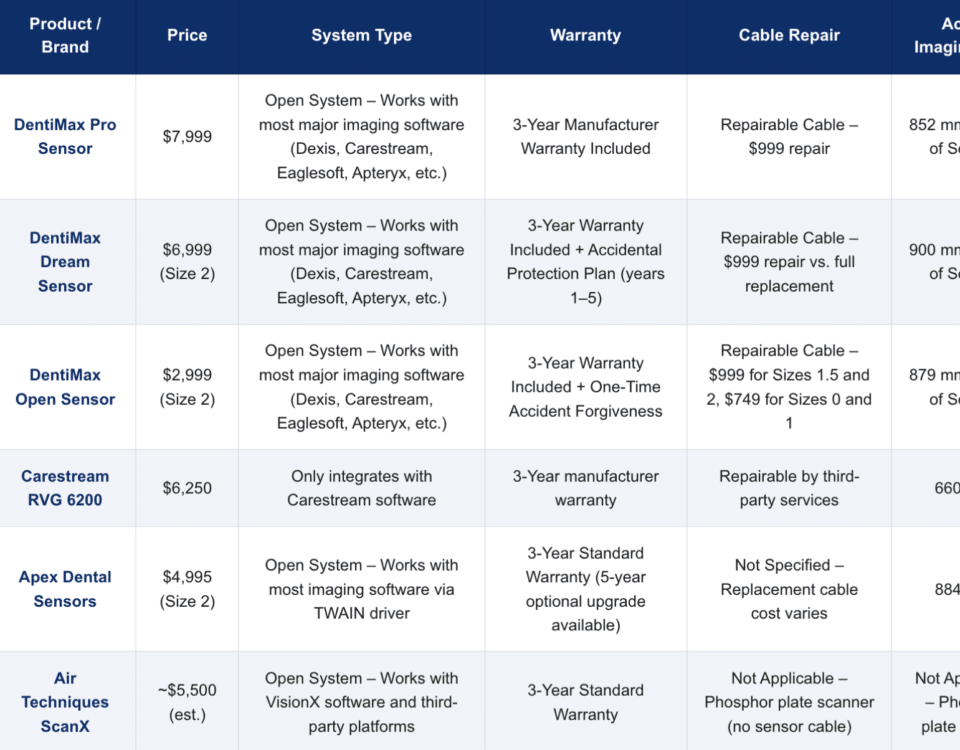
- Modern digital sensors are designed to integrate with many major practice management software platforms (e.g., Dexis, Patterson Eaglesoft, Carestream, Gendex Vixwin), often facilitating smoother workflows and reducing the need for extensive system overhauls.
- Practice management software investments (0.8-1.5% of overhead) improve scheduling efficiency by 15-25%, reduce no-show rates through automated reminders, and accelerate insurance claims processing.
- Practices that strategically invest in patient-facing technology and manage their technology overhead effectively often experience improved case acceptance rates compared to those relying on outdated equipment.
- Initial technology investments ranging from $50,000-$250,000 typically generate ROI within 18-36 months through reduced supply costs, improved efficiency, and increased case acceptance.
Optimizing Dental Office Overhead Through Strategic Technology
Understanding dental office overhead percentages across categories, practice sizes, and specialties enables practice owners to identify cost reduction opportunities while maintaining exceptional patient care. The data from practices analyzed in this report demonstrate that technology investments, particularly in digital imaging, consistently deliver measurable overhead reductions and efficiency gains.
Practices seeking to reduce technology overhead while improving diagnostic capabilities can evaluate digital sensor systems that offer premium image quality at competitive prices. High-quality digital imaging eliminates film costs, reduces chair time, and integrates seamlessly with existing software systems.
Sources
- 2024 Dental Practice Overhead Percentages — Author: Sona Wegner, MBA (Percentology), Publication Date: 2024, Location: United States, URL: https://www.percentology.com/post/2024-dental-practice-overhead-percentages
- Tracking Dental Practice Overhead and What the Results Mean — Author: Allen M. Schiff, CPA, CFE, Publication Date: April 2021, Location: United States, URL: https://www.dentaleconomics.com/practice/overhead-and-profitability/article/14201431/tracking-dental-practice-overhead-and-what-the-results-mean
- Higher Production Helps Offset Chronic Overhead Increases — Author: Roger P. Levin, DDS (Levin Group / Dental Economics 19th Annual Practice Survey), Publication Date: May 2025, Location: United States, URL: https://www.dentaleconomics.com/practice/overhead-and-profitability/article/55280684/higher-production-helps-offset-chronic-overhead-increases
- Dental Overhead Benchmarks 2025-2026: What Top Practices Actually Spend — Author: DentX, Publication Date: January 2026, Location: Canada, URL: https://dentx.ca/blog/dental-overhead-benchmarks/
- Average Dental Practice Revenue in 2025: Complete Breakdown by Specialty — Author: Balaji Mahanam (Overjet), Publication Date: September 2025, Location: United States, URL: https://www.overjet.com/blog/average-dental-practice-revenue-in-2025-complete-breakdown-by-specialty